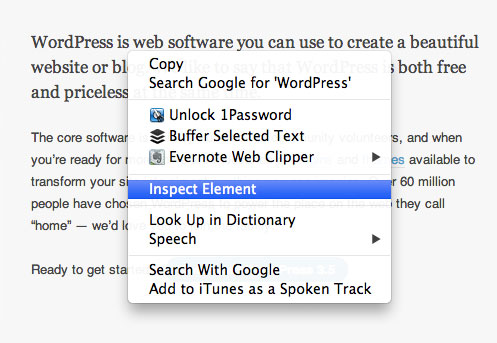
Have you ever wanted to change the color or size of text, find a specific html element or locate a buggy javascript file?
The Developer Tools, bundled and available in Google Chrome and Safari web browsers, allows anyone to inspect the elements (html, css, js) that make up a webpage. Simply right-click on any element in the page and select the “Inspect Element” option from the context menu. This will open the Developer Tools and drill right to the element you clicked on.
Selecting “Inspect Element” will bring up the Developer Tools, which should look like the following:
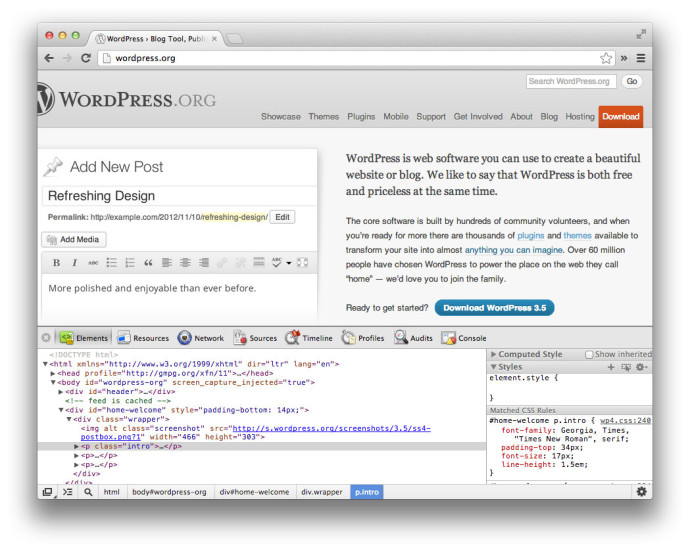
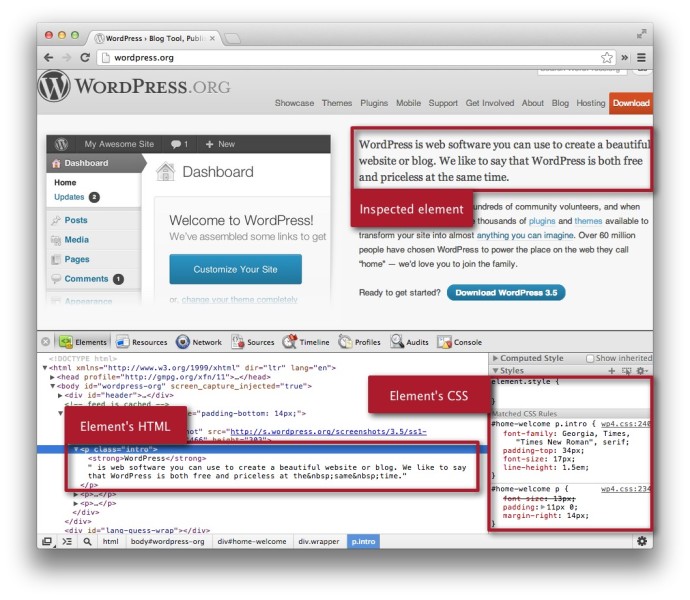
The html of the element that you inspected will be be shown highlighted in the bottom left panel. The css of the element that you inspected with be shown in the bottom right panel.
Clicking on the html code in the left panel and also the css code in the right panel will allow you to preview html or css changes live directly on the page. Lets change the font-family css attribute to Arial and the font-size of the intro class to 24px:
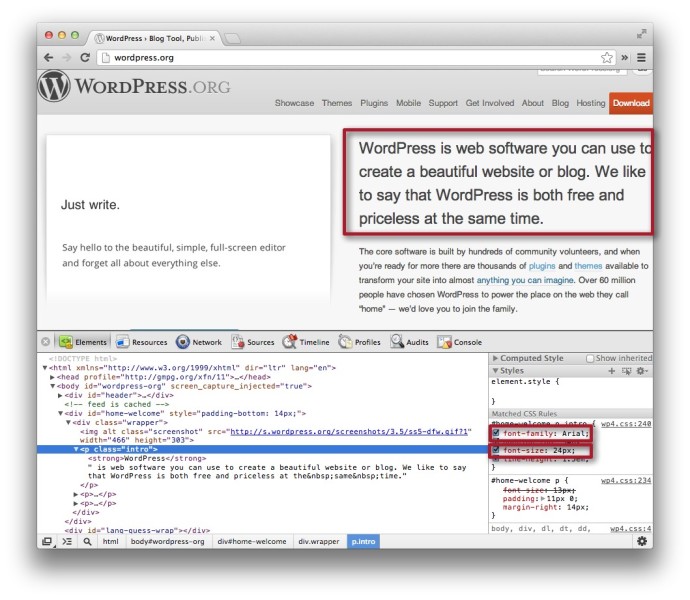
Neat, eh? Using this approach, you can find any element on your webpage, view the html that creates the page and view the css that styles the page.
Important Note
Using Developer Tools doesn’t save these change to your live website. You still need to modify the actual html, css or template file that renders the code. If you are using our WordPress themes, you can visit the Appearance -> Theme Options -> CSS section and paste the code you modified into the textarea to override your theme’s default styles. For the example above, the css would look like this:
#home-welcome p.intro {
font-family: Arial;
font-size: 24px;
}
Developer Tools Video Tutorials
Here are a couple video tutorials for learning more about Chrome’s Developer Tools:
http://www.youtube.com/watch?v=TvJflwF8eYM
Leave a Reply